 Analysis Dashboard Overhaul
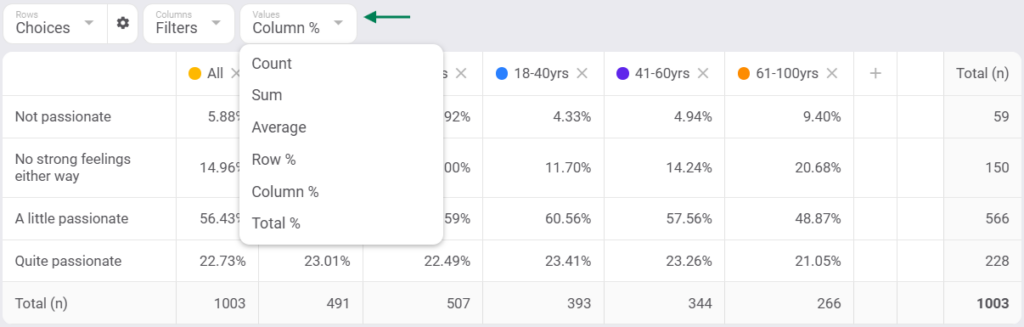
Select Values
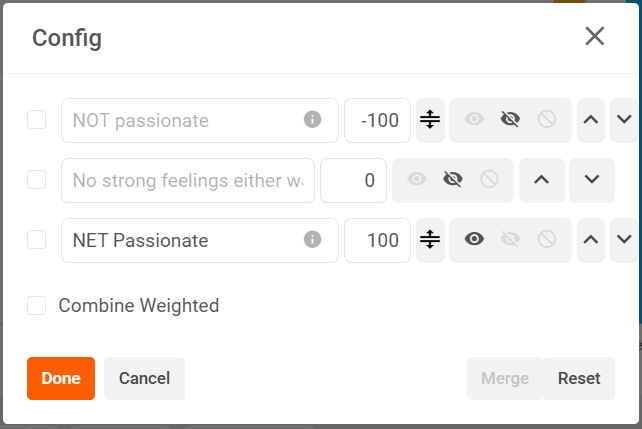
Configuration
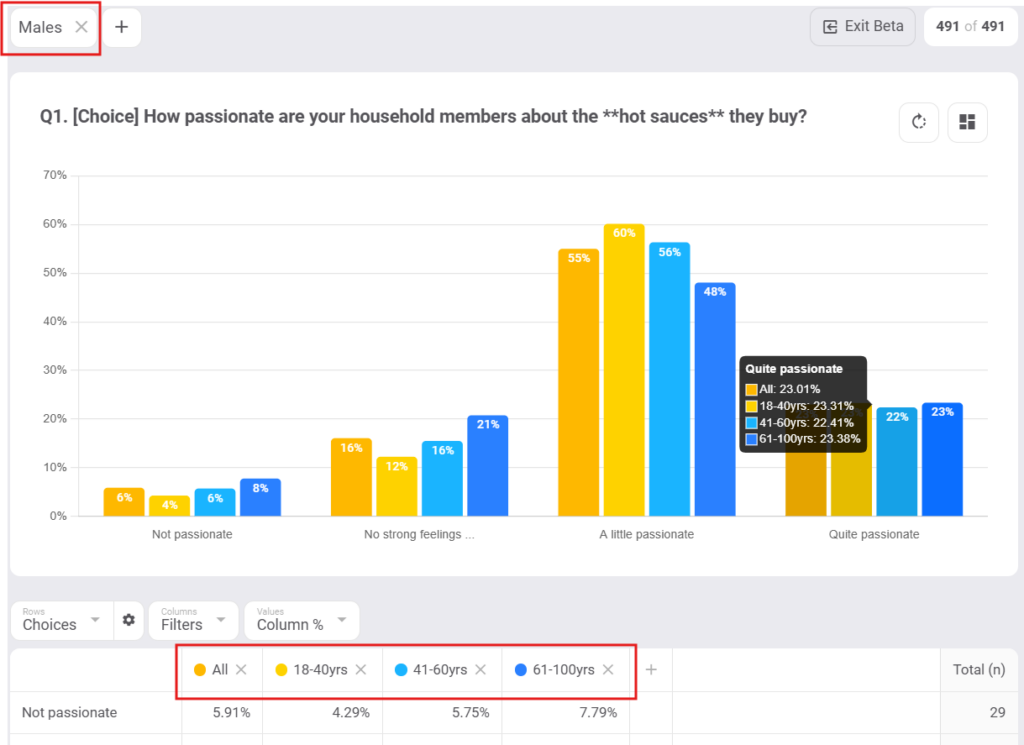
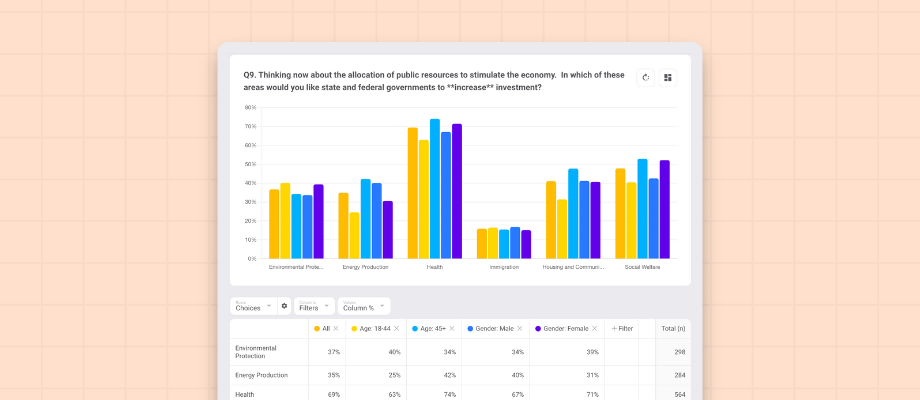
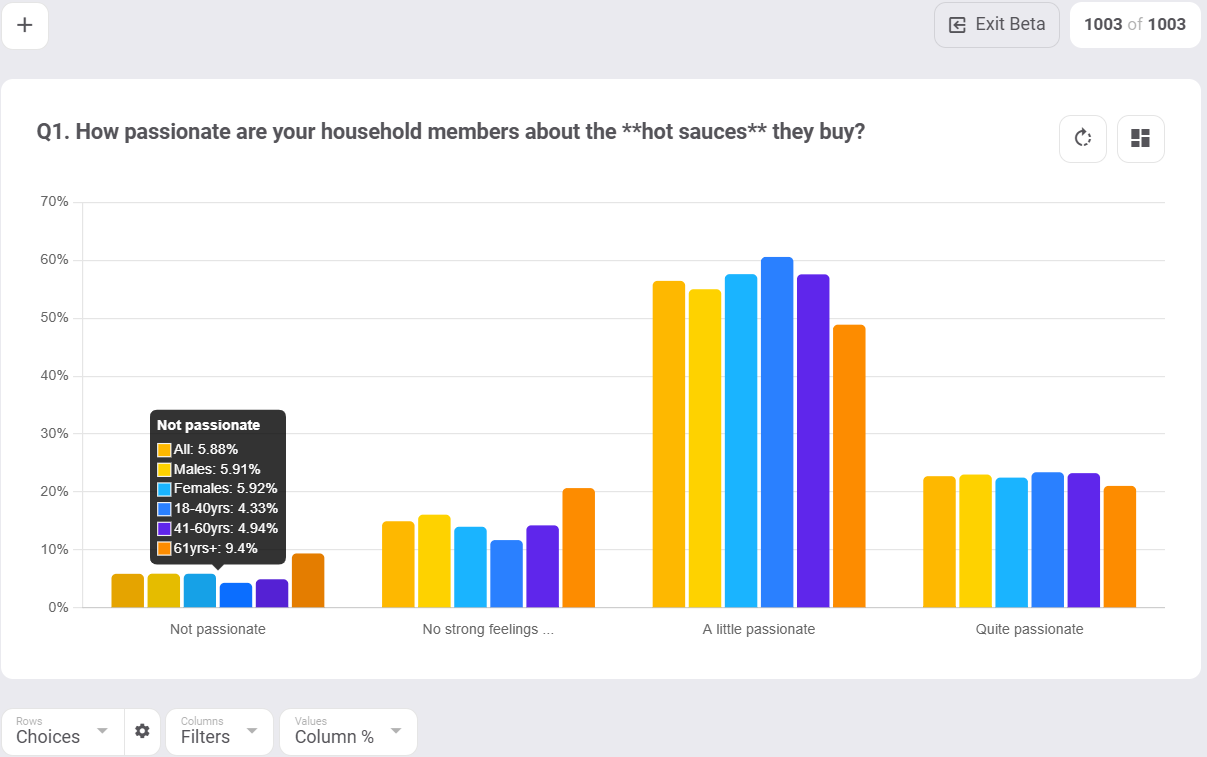
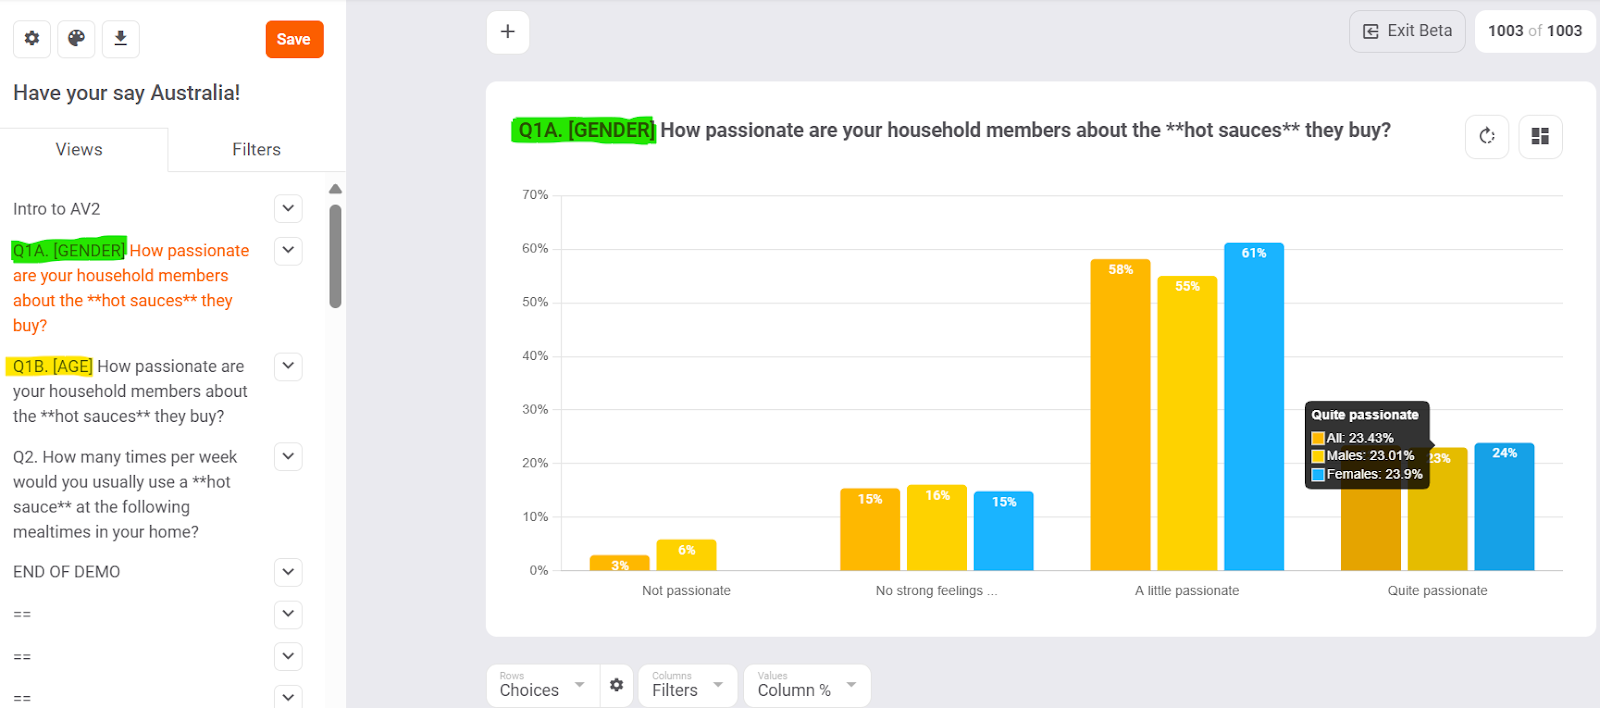
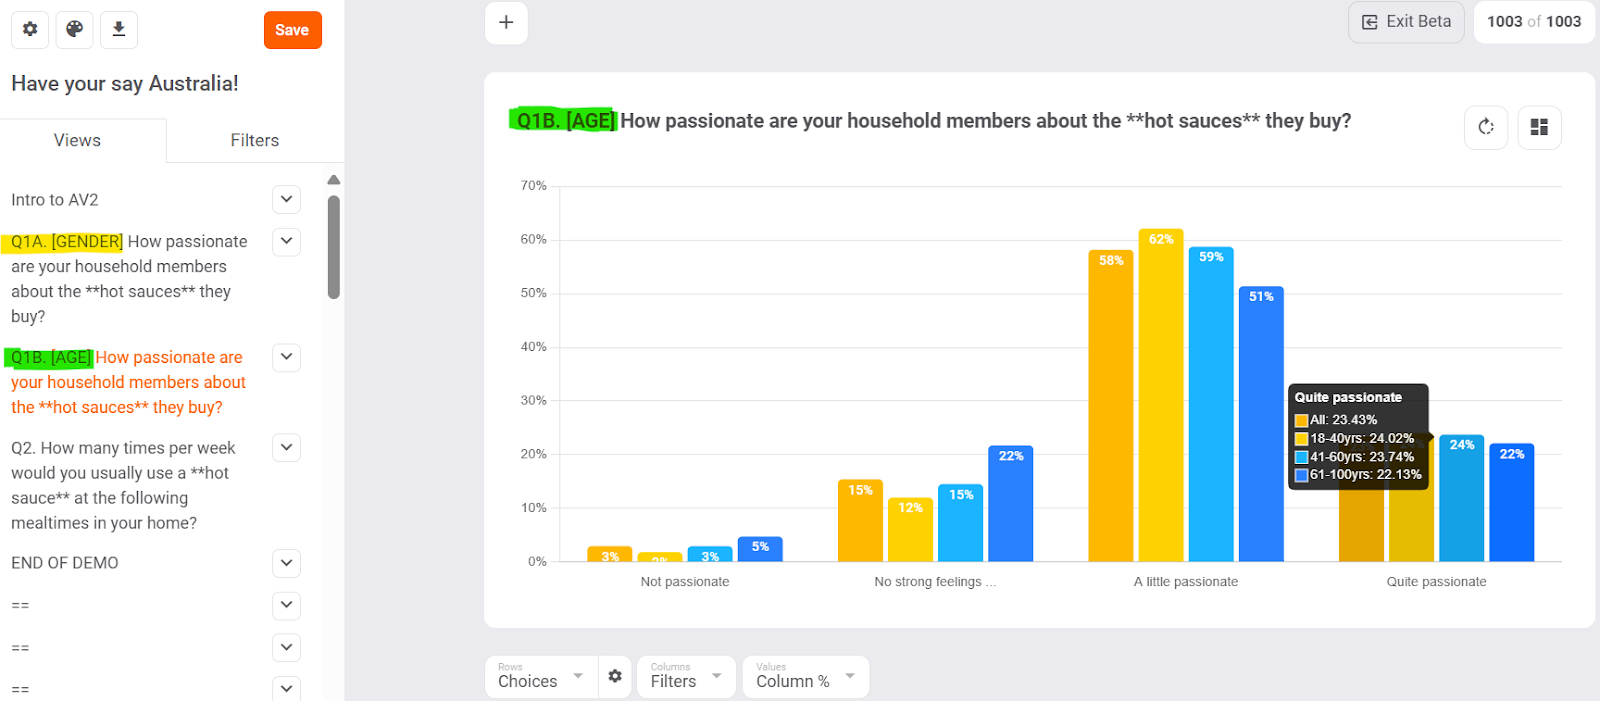
Question Multi-View
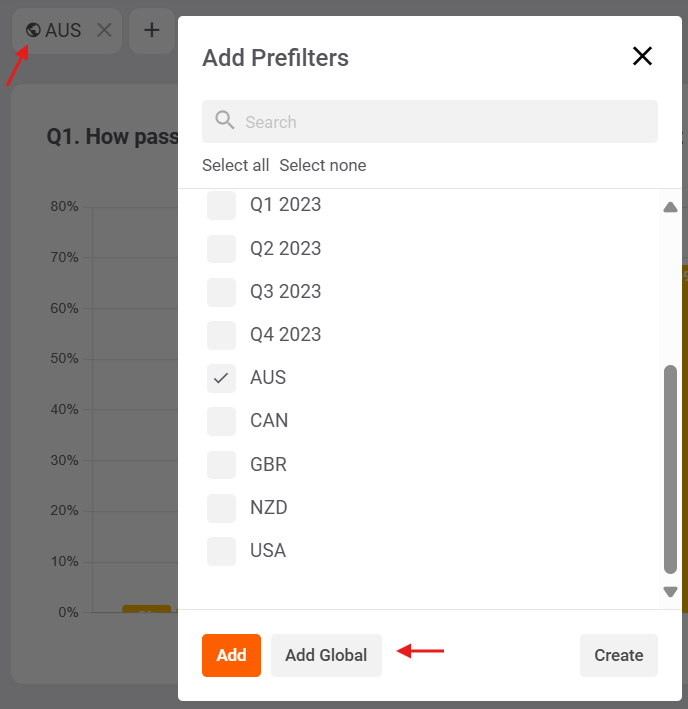
Pre-filters